Electroencephalography
Contents
Electroencephalography
Simply put, Electroencephalography is a (usually) non-invasive method for measuring “brain activity”.
It is a commonly used tool in the neurosciences to establish links between variables of interest such as behavior/cognition/sensory perception/mental processing/differences in personality or psychopathology and their underlying neural mechanims or changes in brain states/traits. An introduction into why and how this is done will be establishd in this chapter.
Common non-research applications that may be of interest are:
Clinical (localization of tumors, diagnosis, brain damage due to head injuries, epilepsy, encephalopathy, encephalitis, stroke, sleeping dsiorder; depth of anesthesia, and possible confirmation of brain death in coma patients)
Brain-computer interfaces (BCI)
If the language used is confusing head over to the EEG glossary or for the more programming related stuff in the later chapters the MNE glossary
Chapter overview:
1. EEG in neuroscience research
What’s the use?
main variables of interest
2. Biophysics
What does “brain activity” or “signal” mean in the context of EEG?
Where does the EEG signal originate from?
EEG source localization
What do we actually measure? What is the EEG code?
Neural oscillations as an integral functional mechanism of the brain
Frequency bands
Function of frequency bands
3. Implications for EEG resarch
What questions can we answer using EEG?
Conducting an EEG study in the context of cognitive neuroscience: a loose framework
Planning/idea to hypothesis
Study design
Study implementation
4. Resources
Tools for EEG-analysis
Where to obtain EEG data ?
Introduction to Electroencephalography
1. EEG in research/neuroscience
What’s the use?
The main selling point of EEG compared to other methods is it’s cost-effectiveness (when compared to MEG or fMRI) and portability (limited), combined with high temporal precision. Allowing for sampling rates of 1024Hz (one sample every 0.001s) and above. As neocortical fast-spiking neurons (association cortex) produce action potentials at a maximal mean frequency of 338 Hz [Wang et al., 2016], it should accordingly be possible to map even the fastest changes in neuronaly activity using EEG.
Therefore EEG allows us to obersve the time course of cognitive processes in high resolution, so that we can divide a processing stream into early components (usually linked to lower level perception (i.e. evoked potentials P100 (visual), N100 (unpredictable stimulus, multiple sensory modalities, P200 (visual search, word expectancy) and later components (Event-related potentials; which are (usually) more closely linked to conscious cognitive processing, such as evaluations or decision making) [Beres, 2017].
We are further not limited to the observation of evoked or event-related potentials (i.e. the averaged signal following a task-demand or stimuli presentation), as the high temporal precision allows us further to identify neural oscillations, the “rhythms of the brain”, and how these relate to fluctuations of internal states or changes in external reality.
Therefore we can, with little investment, capture rich, versatile data (such as event-related & evoked activity, respective their source localization, changes in frequency & time-frequency content, functional connectivity and synchronicity/coherence between neural populations).
The main variables of interest are EEG featuers, most commonly:
Evoked potentials: A wave or complex of waves in the contionously measured EEG signal “elicited by and time-locked to a physiological or nonphysiological stimulus or event” [Mecarelli, 2019]
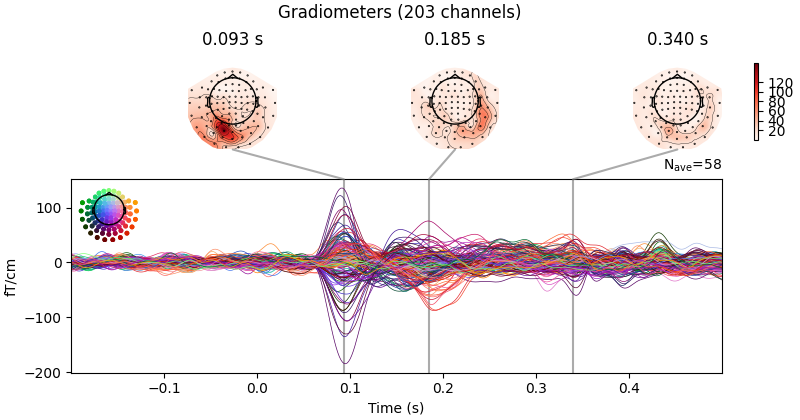
Fig. 89 Evoked potential (p100) after presentation of a visual stimulus on the right side of an participants field of view (MNE tutorials, visualizing evoked potentials, 2022)
Event-related potentials:
Same as evoked potentials, but usually show longer latency responses associated with events, as they are not directly thought to be related to basic sensory processing but to “higher” cognitive tasks such as decision making, response anticipation, evaluation of stimulus features (such as stimulus salience, template matching, novelty detection) [Mecarelli, 2019].
For an overview of different ERPs see e.g. Event Related Potentials (ERP) – Components and Modalities.
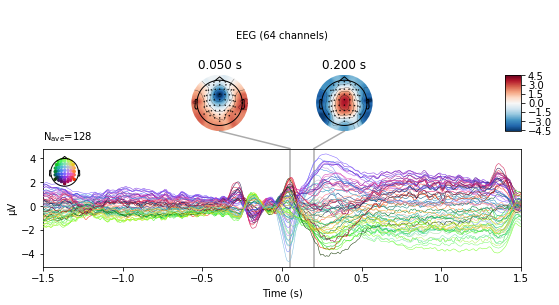
Fig. 90 Event-related-potential: Event-related negativity over central electrodes ~ 50 ms (~ 4µV over FCz) following error commission in a flanker task, 0 is time-locked to a motor response (Master Thesis, Michael Ernst, 2021).
Neural oscillations:
Repetitive, rhythmic patterns in the synchronous activity of neurons or neuron clusters that can be described according to their frequency, phase and amplitude. Usually divided into frequency bands alpha, beta, gamma and so on (NEUROTECHEDU: What are Neural Oscillations?).
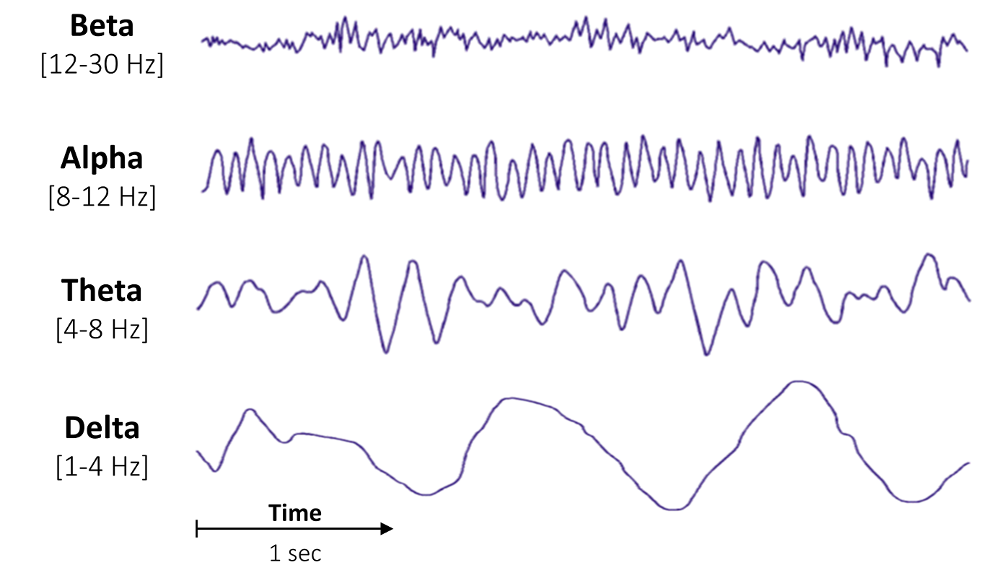
Fig. 91 Illustration of Alpha, Beta, Gamma and Delta frequency bands
(Compute the average bandpower of an EEG signal; Raphael Vallat, 2018)
2. Biophysics
What does “brain activity” or “signal” mean in the context of EEG?
A simple answer would be that we are measuring the summed activity of a number of postsynaptic potentials (i.e the exchange of electrochemical signals) at the scalp.
As the activity of a single neuron or the change in potential at a singluar postynaptic site does not elicit a change in voltage strong enough to be measured at the scalp, only the summation of electrical potentials generated by number of synchronously active neurons that show similar spatial orientation (otherwise their signals cancel each other out) prodcues a signal large enough to be detected at the scalp. This is illustrated in the following graphs, taken from a great resource to understand the biophysics behind the origin of the EEG signal: [Jackson and Bolger, 2014]
Fig. 92 Illustration of differences in amplitude signage at the scalp electrode,
dependent ob the spatial orientation of the dipole of a neuron [Jackson and Bolger, 2014]

Fig. 93 Synchronized activity of spatialy similarly oriented neural populations mesaured at the scalp electrode [Jackson and Bolger, 2014]
A more complex, neuroanatomically informed answer would encompass:
EEG is a method for the (continuous) measurement of spatiotemporally smoothed field potentials above a specific region of the scalp, i.e. the “extracellular currents reflecting the summed dendritic postsynaptic potentials in thousands to millions of pyramidal cells in parallel alignment” (Cf. [Cohen, 2017]) measured at an electrode X placed above region/coordinate Y integrated over an area of 10cm² or more (Cf. [Buzsáki et al., 2012]).
Where does the EEG signal originate from?
EEG source localization
One disadavantage of the EEG is that it is difficult to estimate where neuronal activity originates from, given only the signal measured at the scalp, as the spatial resolution of EEG is fairly limited (centimeter range).
The spatial resolution of the EEG is unfortunately not only limted by the number of electrodes we can place on willing participants (commonly 32-64 channel systems for research; up to 192 channel systems exist) but dependendent on the propagation of the current flow though multiple membranes and the skull, which due to it’s low electrical conductivity and homogenous thickness leads to local changes in conductivity, as well as the skulls non-spherical (and individually varying non-uniform) shape, which results in differences in the distance between electrodes and the center of the head (or varying regions of interest) [Michel and Brunet, 2019].
To find out where the signal measured at an electrode originates, we therfore have to solve a number of problems.
1. How to estimate the signal at a given electrode from a given source, which is understood as the forward problem of EEG.
The forward problem can be overcome with the standardization of tools and methods of measurement. E.g. the standardized 10-20 system that not only describes electrode position and nomenclature, but includes instructions on how to measure a participant’s skulls (Skull circumference, distance preauricular to preauricular and distance Nasion to Inion) and position the EEG-cap. For estimated differences in conductivity due to varying skull thickness ideally an MRI scan of the subject would be provided.
We’ll have to solve the forward problem, before turining towards what’s actually of interest when it comes to source localization of EEG features, which is the …
2. Inverse problem, i.e. which source in the brain produces the signal observed at a given electrode.
Unfortunately the same signal measured at the scalp by a given electrode can be produced by a number of non-unique source distributions, as e.g. the activity (current) generated from different neuron pools may cancel each other out dependent on their relative positions [Michel and Brunet, 2019]. Meaning that we’re dependent on mathematical models (such as LORETA [Pascual-Marqui et al., 1994]) that include a priori assumptions on how the electrical (field) potential produced by neuronal activity propagates through different layers of tissue and bone to reach a given electrode [Michel and Brunet, 2019]. This is generally done by dividing the whole brain volume into a 3d grid of volumetric solution points (voxels) and calculating how a specific pattern of current density (electric current per cross-sectional area) would have to be distributed to be producde by a given source, i.e. a voxel space.
For a detailed explanation and tutorial of EEG source-estimation see the Brainstorm tutorial: source estimation
What do we actually measure? What is the EEG code?
Now, how do we get from the summed activity of neurons to complex, measurable features that are cause or correlation of cognitive and behavioral processes?
Unfortunately, that is above my pay-grade to answer, honestly.

[Cohen, 2017] describes the question of what the EEG signal is, as basically the “The Ultimate but Ultimately Unattainable Goal: One-to-One Mapping between EEG Feature and Microcircuit Configuration”, but offers some insight on why we might justifiably be optimistic that this seemingly unattaiable goal will eventually be achieved. Head over to the linked paper if you want to know more.
 Apparently, (on an ultimately rational level) most researches are content with observing correlations of ERPs/Evoked potentials/changes in neural oscillations and behavioural aspects/presented stimuli.
But the underlying implications for the EEG may on the other hand be explored when we view the EEG as not merely a tool to visualize the isolated activity of a neuron population that produces a “spike” of activity for a temporally distinct event and instead focus on the inherent rhytmic activity of the brain.
Neural oscillations as an integral functional mechanism of the brain
“Brains are foretelling devices and their predictive powers emerge from the various rhythms they perpetually generate. At the same time, brain activity can be tuned to become an ideal observer of the environment, due to an organized system of rhythms. The specific physiological functions of brain rhythms vary from the obvious to the utterly impenetrable” (p.8, [Buzsáki, 2006])
What we can take from this is that:
a. The brain is not a static organ, it’s function is not limited to the mere processing of our outside world, but instead the prediction of possible external events (see also [Friston, 2012]).
b. Rhythms are necessary for the predictive nature of our conscious existence
(such as the phase of oscillations in the alpha band that is predictive of (temporal) perceptual outcomes in visual discrimination tasks and shows significant phase shifts towards an individuals optimal phase for stimulus discrimination when presented with predictive cues about the temporal nature of a future event [Samaha et al., 2015].
c. Rhythms can “tune” the brain towards different “states” of activity (e.g. when switching from attentive to relaxed to different stages of sleep)
It follows that the brain can be understood as a system of functionally connected oscillators (or pattern generators) and that the perturbations of the generated rhythms due to internal or external factors are the main mechanisms that allow us to adapt to our surroundings. They are not only relevant for prediction, but also the synchronization of operations/activity between local neuron clusters and more distant regions. Functions without which we’d suffer from a plethora of “rhythm-based cognitive maladies”, such as epilepsy, Parkinson’s or sleep disorders (p.9, [Buzsáki, 2006]).
One of the simplest forms that an oscillator may take and therefore a good illustration for the usefulness of rhythmic activity is the central pattern generator (CGP). Central pattern generators are used for walking, breathing and other rhythmical behavioral patterns (p.144, [Buzsáki, 2006]). The article ”If i only had a spine” by Audra Davidson, that the illustration below is borrowed from, shows a very simplistic CGP, containing only 2 neurons at the level of the spinal cord and given a “go” signal from the brain, allows for the production of ongoing synchronized activity according to a pre-specified plan, i.e. extending and contracting a target muscle, until the brain sends further instructions.

Fig. 94 Illustration of a central pattern generator ( Audra Davidson (2019)).
If we now further complicate this pattern of synchronous exictatory activations aimed a different target sites by introducing inhibitory neurons, rather quickly non-linearity in the organized activity of cortical circuits emerges. While the fine balance between excitatory and inhibitiory activations is often accomplished by oscillations, with the introduction of non-linearity, chaos (theory) follows (p.62, [Buzsáki, 2006]). The emerging perspective is that the brain constitutes a system that at most times operates in a state of “self-organized criticality”, or put differently the “border between predictable periodic behavior and unpredictable chaos” (p.145, [Buzsáki, 2006]) While this may sound problematic at first glance, it is a necessary attribute of our nervous system, as such a state allows for dynamics that favor quick and flexible reactions to internal and external perturbations. Therefore this critical state poses a “clear advantage for the cerebral cortex since it can respond and reorganize it’s dynamics in response to the smallest and weakest perturbations” (p.145, [Buzsáki, 2006]). Once we then react to an external perturbation or direct our attention towards a certain task, we may switch to robust, predictable oscillatory activity (p.111, [Buzsáki, 2006]).
Frequency bands
These states of oscillatory synchrony are believed to be constrained to certain patterns or “frequency bands” that give rise to a number of different functions. In EEG literature you’ll generally come across the following frequency bands, although their exact borders are bound to slightly differ between publications, as they were originally drawn somewhat arbitrarily out of the necessity to accomodate early EEG recording technology.
                                    delta - 0.5–4 hertz
                                    theta - 4–8 hertz
                                    alpha - 8–12 hertz
                                    beta - 12–30 hertz
                                    gamma - > 30 hertz
Other definitions that are closer to practictal considerations exist, e.g. provided by the McGill Physiology Lab for Biomedical Signals Acquisition, which additionally offers descriptions of commonly observed amplitude and location.
Or simply head over to Wikipedia; EEG Comparison of frequency bands

In general it should be noted that it is good practice to define your frequency range of interest when searching or publishing studies, as the important info is the actual frequency band used not the potential buzzword.
Function of frequency bands
Frequency bands can be understood to define the gates of temporal processing, as each oscillatory cylce constitutes a temporary processing window, which (may) signal the beginning and ending of an encoded piece of neuronal information (p.115, [Buzsáki, 2006]).
The frequency of an oscillatory band determines the length of this temporal window and is in turn (partly) determined by the size of the neuronal pool that produces the frequency band. While slow oscillatons usually involve greater numbers of neurons over larger areas of the brain, fast oscillations are used for local integration requiring short time windows (p.116, [Buzsáki, 2006]). For example, alpha and theta rhythms are thought to bind more distant areas into functional units, thereby modulating the activity of locally more restrained clusters controlled by faster oscillatory activity [].
As there is simply no way to write a comprehensive review of associated functions and regional differences for all commonly observed frequency bands given the format of this course, below we’ll list some sample literature on modern interpretations/research on the possible functions that the most common frequency bands are associated with.
Delta
Sleep classification according to AASM and Rechtschaffen & Kales: effects on sleep scoring parameters [Moser et al., 2009]
EEG delta oscillations as a correlate of basic homeostatic and motivational processes [Knyazev, 2012]
Gamma
Gamma rhythms mediate feedforward communication (Cortical layers, rhythms and BOLD signals [Scheeringa and Fries, 2019])
Theta
Alpha
Beta
If you want to know more about how rhythmic activity defines the neural system or how rhythms emerge, i highly advise the book ”Rhythms of the Brain” by Buzsáki (2006) for further reading.
3. Implications for EEG resarch
What questions can we answer using EEG?
How and according to which rules does the brain react to external/internal perturbations and how/why does it generate internal perturbations?
How encoding takes place (ERP; Change in power/coherence/phase-perturbation in a specfific frequency band; cross-frequency coupling etc.)
Does an EEG component reflect a certain function? Content that the EEG feature represents? (e.g. algorithms for the integration of information, prediction, preparation of an action)
Timing or timeline of neural processes?
How does information travel across neural populations? I.e. what’s the flow of “neural” information when e.g. a stimuli was presented?
In what areas does “computation” takes place? (Source localization; usually better answered with fMRI)
So we can
map brain activity to behaviour/external factors
explore the (possible mathematical/methodological) laws according to which information is received, transformed or applied
and find which areas are involved/responsible
An aspect that we’ll not explore further, that is especially prominent in clinical and personality psychology: Do Indviduals differ in EEG features based on certain traits/staes (e.g. psychopathology)?
Two approaches to answer questions of this nature are exemplified in the 2 studies below:
EEG Frequency Bands in Psychiatric Disorders: A Review of Resting State Studies [Newson and Thiagarajan, 2019]
Understanding event-related potentials (ERPs) in clinical and basic language and communication disorders research: a tutorial [McWeeny and Norton, 2020]
Conducting an EEG study in the context of cognitive neuroscience: a loose framework
A. Planning/idea to hypothesis
E.g. as a primer, we can use Marr’s 3 levels for the analysis of information-processing systems (p.25, [Marr, 2010]):
To understand how a system operates (how a specific (beahvioral) goal is achieved, how a cognitive function can bes established etc.) we can formulate 3 distinct levels of analysis:
1. Computational level: What is the goal/purpose of the system?
2. Representation/Algorithm: how does the system solve this task? What are the representations of the input/output and how are these processed or manipulated (i.e. what is the algorithm according to which the goal is achieved)?
3. Implementation: the physiological implementation; i.e. what parts would a system need to solve it’s purpose/to allow for the algorithm to work?
Let’s try this on a simple example:
E.g. we know that humans are able to differentiate pure tones based on pitch (otherwise music would be quite boring), so there has to be a system in place that enables this process, right?
1.Computational level:
goal = differentiate between 2 soundwaves with different frequencies;
purpose=?
2. Representation/algorithm:
input: electric signals/neuron activation in different sensitive parts of the auditory cortex (mechanotransduction) + neural representation of time?
output: ??? Possibly an ERP “Z”?
algorithm:
X-Y = Z (probably a bit more complex, but you get the idea)
(where activation of region A corresponding to frequency A = X; activation of region B corresponding to frequency B = Y)
3. Implementation (i.e. “hardware”):
   receptor sensitive for frequency content of Soundwave (Auditory hair cells)
   -> mechano-electrical transduction (MET) channels
   -> ???
   -> action potential in the connected auditory-nerve fiber
   -> ...
   -> sub-regions of the auditory cortex tuned to specific tone frequencies
   -> associative cortex?
(3. [Ahveninen et al., 2016]; Wikipedia: Neural encoding ouf sound )
B. Study design
Now you ideally have not only the starting question/hypothesis but a rough understanding of which areas of your research/study need to be further explored or appear to be sufficient to answer them. Next you can ask yourself how and what data/information you’ll need to collect to fill in the gaps of your understanding.
solid understanding of theory (e.g. error monitoring; auditory processing) and biophysics?; What stimuli/paradigm to use? rate of stimuli presentation? expected time-frame of activity? etc.
what data do you expect/need? (technical aspects, such as sampling frequency, how many electrodes, additional mri scans)
sample size, sample composition, how many trials/blocks/conditions?
priors?; justificiaton for your alphas [Lakens et al., 2018]?
C. Study implementation
peregistration of methods?
Data collection
Standardization; testing-protocol; participant’s intructions
Pilot-testing
Post-tesing questionnaire
Experiment log
Math

Preprocessing (see following chapters) -> signal-to-noise ratio/power?
Analytical techniques
Followed by
classical statistics - MNE: Statistical analysis of sensor data
machine learning
D. Making sound inferences?
biologically/physiologically/theoretically informed and statistically valid?
does your level of certainity (presented/believed) match the degree of evidence?
Generalizability of sample? (WEIRD?)
other considerations?
4. Resources
Tools for EEG-analysis
MNE
A Python based open source tool for EEG/MEG analysis, that you’ll get to know in the following chapters.
In-depth MNE: MEG and EEG data analysis with MNE-python [Gramfort, 2013]
References
- 1
Jyrki Ahveninen, Wei-Tang Chang, Samantha Huang, Boris Keil, Norbert Kopco, Stephanie Rossi, Giorgio Bonmassar, Thomas Witzel, and Jonathan R. Polimeni. Intracortical depth analyses of frequency-sensitive regions of human auditory cortex using 7T fMRI. NeuroImage, 143:116–127, December 2016. URL: https://linkinghub.elsevier.com/retrieve/pii/S1053811916304712 (visited on 2022-05-02), doi:10.1016/j.neuroimage.2016.09.010.
- 2
Jacopo Barone and Holly E. Rossiter. Understanding the Role of Sensorimotor Beta Oscillations. Frontiers in Systems Neuroscience, 15:655886, May 2021. URL: https://www.frontiersin.org/articles/10.3389/fnsys.2021.655886/full (visited on 2022-04-29), doi:10.3389/fnsys.2021.655886.
- 3
Anna M. Beres. Time is of the Essence: A Review of Electroencephalography (EEG) and Event-Related Brain Potentials (ERPs) in Language Research. Applied Psychophysiology and Biofeedback, 42(4):247–255, December 2017. URL: http://link.springer.com/10.1007/s10484-017-9371-3 (visited on 2022-04-29), doi:10.1007/s10484-017-9371-3.
- 4(1,2,3,4,5,6,7,8,9)
György Buzsáki. Rhythms of the Brain. Oxford University Press, October 2006. ISBN 978-0-19-530106-9. URL: https://oxford.universitypressscholarship.com/view/10.1093/acprof:oso/9780195301069.001.0001/acprof-9780195301069 (visited on 2022-04-29), doi:10.1093/acprof:oso/9780195301069.001.0001.
- 5
György Buzsáki, Costas A. Anastassiou, and Christof Koch. The origin of extracellular fields and currents — EEG, ECoG, LFP and spikes. Nature Reviews Neuroscience, 13(6):407–420, June 2012. URL: http://www.nature.com/articles/nrn3241 (visited on 2022-04-29), doi:10.1038/nrn3241.
- 6
James F. Cavanagh and Michael J. Frank. Frontal theta as a mechanism for cognitive control. Trends in Cognitive Sciences, 18(8):414–421, August 2014. URL: https://linkinghub.elsevier.com/retrieve/pii/S1364661314001077 (visited on 2022-04-29), doi:10.1016/j.tics.2014.04.012.
- 7
Michael S. Clayton, Nick Yeung, and Roi Cohen Kadosh. The many characters of visual alpha oscillations. European Journal of Neuroscience, 48(7):2498–2508, October 2018. URL: https://onlinelibrary.wiley.com/doi/10.1111/ejn.13747 (visited on 2022-04-29), doi:10.1111/ejn.13747.
- 8(1,2)
Michael X Cohen. Where Does EEG Come From and What Does It Mean? Trends in Neurosciences, 40(4):208–218, April 2017. URL: https://linkinghub.elsevier.com/retrieve/pii/S0166223617300243 (visited on 2022-04-29), doi:10.1016/j.tins.2017.02.004.
- 9
Karl Friston. The history of the future of the Bayesian brain. NeuroImage, 62(2):1230–1233, August 2012. URL: https://linkinghub.elsevier.com/retrieve/pii/S1053811911011657 (visited on 2022-05-02), doi:10.1016/j.neuroimage.2011.10.004.
- 10
Alexandre Gramfort. MEG and EEG data analysis with MNE-Python. Frontiers in Neuroscience, 2013. URL: http://journal.frontiersin.org/article/10.3389/fnins.2013.00267/abstract (visited on 2022-04-29), doi:10.3389/fnins.2013.00267.
- 11(1,2,3)
Alice F. Jackson and Donald J. Bolger. The neurophysiological bases of EEG and EEG measurement: A review for the rest of us: Neurophysiological bases of EEG. Psychophysiology, 51(11):1061–1071, November 2014. URL: https://onlinelibrary.wiley.com/doi/10.1111/psyp.12283 (visited on 2022-04-29), doi:10.1111/psyp.12283.
- 12
Gennady G. Knyazev. EEG delta oscillations as a correlate of basic homeostatic and motivational processes. Neuroscience & Biobehavioral Reviews, 36(1):677–695, January 2012. URL: https://linkinghub.elsevier.com/retrieve/pii/S0149763411001849 (visited on 2022-04-29), doi:10.1016/j.neubiorev.2011.10.002.
- 13
Daniel Lakens, Federico G. Adolfi, Casper J. Albers, Farid Anvari, Matthew A. J. Apps, Shlomo E. Argamon, Thom Baguley, Raymond B. Becker, Stephen D. Benning, Daniel E. Bradford, Erin M. Buchanan, Aaron R. Caldwell, Ben Van Calster, Rickard Carlsson, Sau-Chin Chen, Bryan Chung, Lincoln J. Colling, Gary S. Collins, Zander Crook, Emily S. Cross, Sameera Daniels, Henrik Danielsson, Lisa DeBruine, Daniel J. Dunleavy, Brian D. Earp, Michele I. Feist, Jason D. Ferrell, James G. Field, Nicholas W. Fox, Amanda Friesen, Caio Gomes, Monica Gonzalez-Marquez, James A. Grange, Andrew P. Grieve, Robert Guggenberger, James Grist, Anne-Laura van Harmelen, Fred Hasselman, Kevin D. Hochard, Mark R. Hoffarth, Nicholas P. Holmes, Michael Ingre, Peder M. Isager, Hanna K. Isotalus, Christer Johansson, Konrad Juszczyk, David A. Kenny, Ahmed A. Khalil, Barbara Konat, Junpeng Lao, Erik Gahner Larsen, Gerine M. A. Lodder, Jiří Lukavský, Christopher R. Madan, David Manheim, Stephen R. Martin, Andrea E. Martin, Deborah G. Mayo, Randy J. McCarthy, Kevin McConway, Colin McFarland, Amanda Q. X. Nio, Gustav Nilsonne, Cilene Lino de Oliveira, Jean-Jacques Orban de Xivry, Sam Parsons, Gerit Pfuhl, Kimberly A. Quinn, John J. Sakon, S. Adil Saribay, Iris K. Schneider, Manojkumar Selvaraju, Zsuzsika Sjoerds, Samuel G. Smith, Tim Smits, Jeffrey R. Spies, Vishnu Sreekumar, Crystal N. Steltenpohl, Neil Stenhouse, Wojciech Świątkowski, Miguel A. Vadillo, Marcel A. L. M. Van Assen, Matt N. Williams, Samantha E. Williams, Donald R. Williams, Tal Yarkoni, Ignazio Ziano, and Rolf A. Zwaan. Justify your alpha. Nature Human Behaviour, 2(3):168–171, March 2018. URL: http://www.nature.com/articles/s41562-018-0311-x (visited on 2022-04-29), doi:10.1038/s41562-018-0311-x.
- 14
David Marr. Vision: a computational investigation into the human representation and processing of visual information. MIT Press, Cambridge, Mass, 2010. ISBN 978-0-262-51462-0. OCLC: ocn472791457.
- 15
Sean McWeeny and Elizabeth S. Norton. Understanding event‐related potentials (ERPs) in clinical and basic language and communication disorders research: a tutorial. International Journal of Language & Communication Disorders, 55(4):445–457, July 2020. URL: https://onlinelibrary.wiley.com/doi/10.1111/1460-6984.12535 (visited on 2022-04-29), doi:10.1111/1460-6984.12535.
- 16(1,2)
Oriano Mecarelli. Clinical electroencephalography. Springer, 2019. ISBN 978-3-030-04573-9 978-3-030-04572-2. OCLC: 1104140146. URL: https://link.springer.com/content/pdf/bbm%3A978-3-030-04573-9%2F1.pdf (visited on 2022-04-29).
- 17(1,2,3)
Christoph M. Michel and Denis Brunet. EEG Source Imaging: A Practical Review of the Analysis Steps. Frontiers in Neurology, 10:325, April 2019. URL: https://www.frontiersin.org/article/10.3389/fneur.2019.00325/full (visited on 2022-04-29), doi:10.3389/fneur.2019.00325.
- 18
Doris Moser, Peter Anderer, Georg Gruber, Silvia Parapatics, Erna Loretz, Marion Boeck, Gerhard Kloesch, Esther Heller, Andrea Schmidt, Heidi Danker-Hopfe, Bernd Saletu, Josef Zeitlhofer, and Georg Dorffner. Sleep Classification According to AASM and Rechtschaffen & Kales: Effects on Sleep Scoring Parameters. Sleep, 32(2):139–149, February 2009. URL: https://academic.oup.com/sleep/article-lookup/doi/10.1093/sleep/32.2.139 (visited on 2022-04-29), doi:10.1093/sleep/32.2.139.
- 19
Jennifer J. Newson and Tara C. Thiagarajan. EEG Frequency Bands in Psychiatric Disorders: A Review of Resting State Studies. Frontiers in Human Neuroscience, 12:521, January 2019. URL: https://www.frontiersin.org/article/10.3389/fnhum.2018.00521/full (visited on 2022-04-29), doi:10.3389/fnhum.2018.00521.
- 20
R.D. Pascual-Marqui, C.M. Michel, and D. Lehmann. Low resolution electromagnetic tomography: a new method for localizing electrical activity in the brain. International Journal of Psychophysiology, 18(1):49–65, October 1994. URL: https://linkinghub.elsevier.com/retrieve/pii/016787608490014X (visited on 2022-04-29), doi:10.1016/0167-8760(84)90014-X.
- 21
Jason Samaha, Phoebe Bauer, Sawyer Cimaroli, and Bradley R. Postle. Top-down control of the phase of alpha-band oscillations as a mechanism for temporal prediction. Proceedings of the National Academy of Sciences, 112(27):8439–8444, July 2015. URL: https://pnas.org/doi/full/10.1073/pnas.1503686112 (visited on 2022-04-29), doi:10.1073/pnas.1503686112.
- 22
René Scheeringa and Pascal Fries. Cortical layers, rhythms and BOLD signals. NeuroImage, 197:689–698, August 2019. URL: https://linkinghub.elsevier.com/retrieve/pii/S1053811917309096 (visited on 2022-04-29), doi:10.1016/j.neuroimage.2017.11.002.
- 23
Bo Wang, Wei Ke, Jing Guang, Guang Chen, Luping Yin, Suixin Deng, Quansheng He, Yaping Liu, Ting He, Rui Zheng, Yanbo Jiang, Xiaoxue Zhang, Tianfu Li, Guoming Luan, Haidong D. Lu, Mingsha Zhang, Xiaohui Zhang, and Yousheng Shu. Firing Frequency Maxima of Fast-Spiking Neurons in Human, Monkey, and Mouse Neocortex. Frontiers in Cellular Neuroscience, October 2016. URL: http://journal.frontiersin.org/article/10.3389/fncel.2016.00239/full (visited on 2022-04-29), doi:10.3389/fncel.2016.00239.